Overview
Inventory management is crucial for efficient supply chain operations. This case study applies EOQ and ROP models to assess how demand fluctuations and supply delays affect inventory strategy.
Calculator Functionality
EOQ = sqrt(2DS/H)— Economic Order Quantity (units)ROP = d × L + safety stock— Reorder Point (units)
EOQ & ROP Calculator
Compute reorder points and economic order quantities with simulations.
Quick simulations
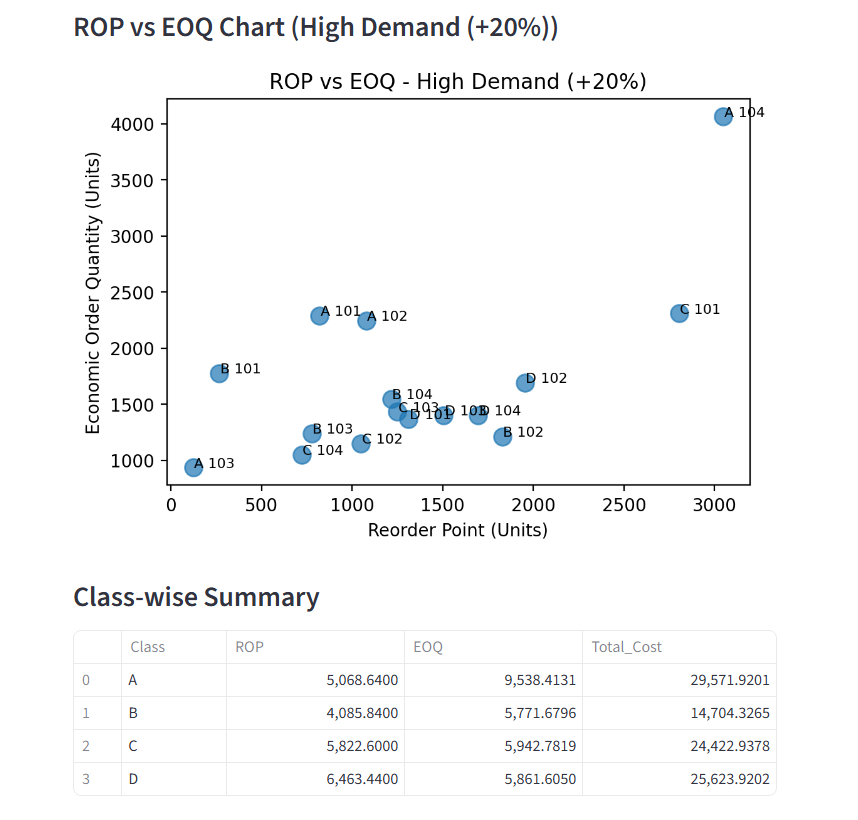
Scenario One: 20% High Demand
Issues
- Sudden 20% demand surge across multiple SKUs
- Risk of stockouts if safety stock is not adjusted
Goals
- Recalculate ROP to maintain service levels
- Control inventory costs despite higher demand
Results
Under a simulated 20% demand increase, reorder points rose ~15% on average, which would require earlier reorders to prevent stockouts (e.g., A 104 from 2,300 to 2,640 units). EOQ values increased ~10%, indicating larger optimal batches. Total annual inventory costs also rose ~10% (C 101 from $11,071 to $12,128). These results show that while higher demand drives increased cost, adjusting ROP and EOQ reduces stockout risk and maintains service levels during peak periods.
Suggested Actions
- Focus on increasing safe stock of high demand items, in this case product A 101 and A 104 are high priority items.
- Instead of one large EOQ batch, place smaller, more frequent orders during high demand periods. This can ensure safe investments on current high demand products and not over investing when demand suddenly slows.
- Research trends and consistent outcomes of holidays, promotions, social trends, and collaborate with suppliers by sharing forecasts ahead of time.
- Shape the demand by using buying limits, substitutions, and promotions to maintain service levels.
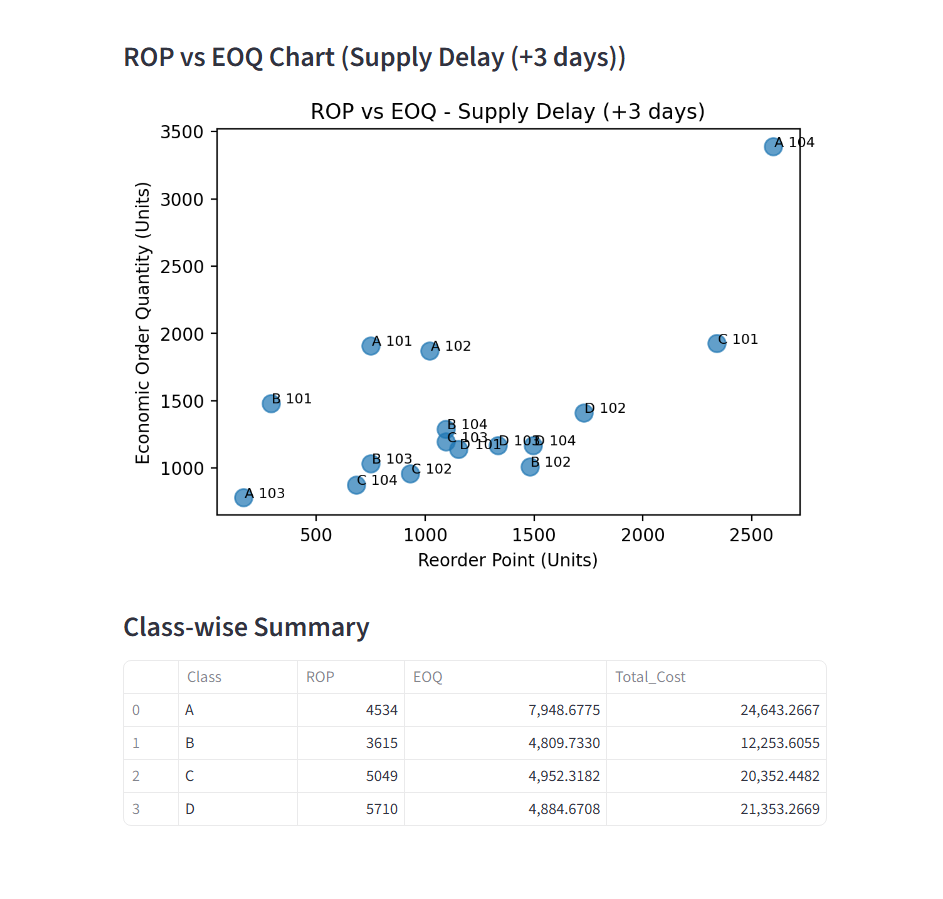
Scenario Two: Supply Delay (+3 days)
Issues
- 3-day increase in supplier lead time
- ROP spikes between 30%–70% depending on SKU
Goals
- Protect service levels during delay
- Avoid excessive carrying costs
Results
When simulating a supply delay of +3 days, reorder points increased dramatically — by 30% to 70% depending on SKU (e.g., B 101 from 200 to 338 units). EOQ rose modestly (~10%), but higher ROP values indicate a greater need for safety stock to cover lead-time variability. To mitigate these risks, businesses should increase safety stock selectively for fast-moving SKUs, negotiate expedited shipments for high-revenue items, and explore supplier diversification. Slow movers (Class C/D) should not see significant safety stock increases to avoid excess carrying costs.
Suggested Actions
- Diversify suppliers to mitigate risk of stockout by building relationships with other suppliers and implement dynamic reorder policies such as raising ROP and safety stock temporarily during high demand. For example: "If demand raises by approximately __%, refer to the following recommended points of ordering for product in _____ class or department."
- Plan dynamic reorder policies and methods such as raising ROP and safety stock temporarily during periods high demand. For example, “When product reaches ____% demand for _____ consecutive days, set reorder point to _____.”
- For slower moving products, don’t raise stock levels aggressively — extra lead time matters less because they are purchased by guests at a lesser rate.
Scenario Three: High Demand + Delay
Issues
- Simultaneous 20% demand surge and 3-day delay
- Severe risk of stockouts and carrying costs
Goals
- Balance high demand with longer replenishment
- Maintain customer service without excess stock
Results
When simulating a combined 20% demand surge and +3 day supply delay, reorder points increased dramatically (e.g., B 101 from 200 to 338 units, +69%). EOQ values rose moderately (~10%), but stockout exposure became severe without additional buffers. Total costs increased ~10%, but the larger risk is unmet demand. To mitigate this, we recommend temporarily raising safety stock for Class A SKUs, placing advance orders before peak demand, diversifying suppliers, and prioritizing fast movers for expedited replenishment. This strategy balances service levels with inventory cost during worst-case conditions.
Suggested Actions
- Prioritize placing larger orders before peak demand when suppliers are still reliable and pricing of the products are low. This ensures having product before competitors and losing out on deals.
- Use demand shaping (promotions, buying limits)
- Adopt temporary dynamic reorder policies
Conclusion
This analysis demonstrates how EOQ and ROP models can guide inventory strategy during volatility. By modeling scenarios, managers can proactively adjust safety stock, diversify suppliers, and balance costs against service levels.